When Reversals Occur!
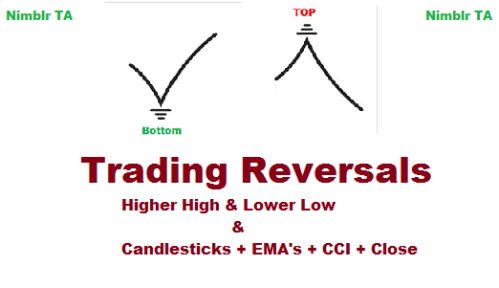
When Reversals Occur!
What is the likely starting event when it is time for Reversals?
Reversals could be at a High to go short or at Low to go long.
STEP 1
Reversal starts with a Day’s High that is higher than the previous two days High or a Day’s Low that is lower than previous two days Low.
What does a Day’s high that is higher than previous two days High look like? Here is a 15min chart of prior three days to illustrate.

You will find a High formed during the day that is Higher than previous two days High.
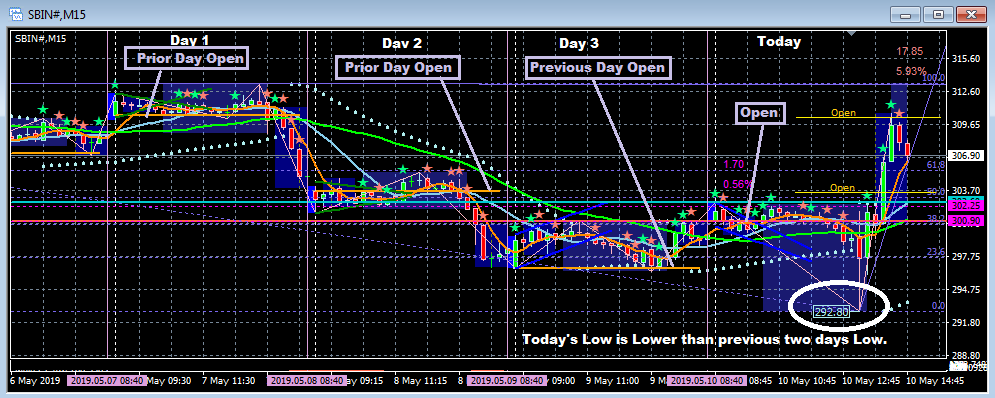
What does a Day’s Low that is lower than previous two days Low look like? Here is a 15min chart of prior three days to illustrate.
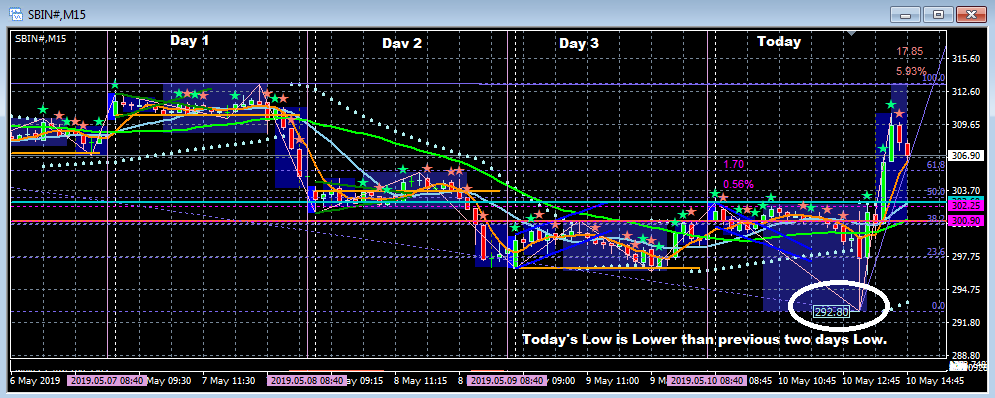
You will find a Low formed during the day that is lower than previous two days Low.
Such an occurrence is the starting to a likely Reversal. One therefore needs to go long or short with a caution if High or Low is formed on the third consecutive day.
Later on, will separately consider Low or High of Yesterday as Lower or Higher than previous two days cases too in a separate blog post.
Step 2
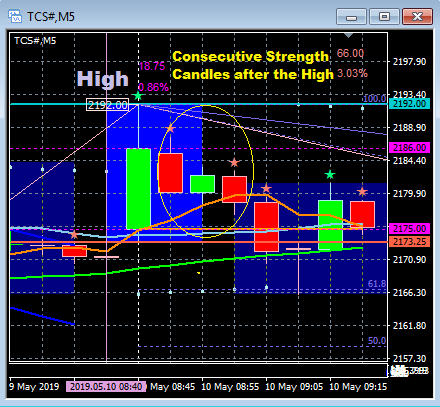
Spot two consecutive strength star marked candles after the High or Low as a confirmation of Intra Day Top or Bottom.
Let’s spot the consecutive strength star marked candles that support the breakout on the chart with High that is higher than previous two days.

Close look at the Consecutive Candles.
Let’s spot the consecutive strength star marked candles that support the breakout on Low that is lower than previous two days Low.
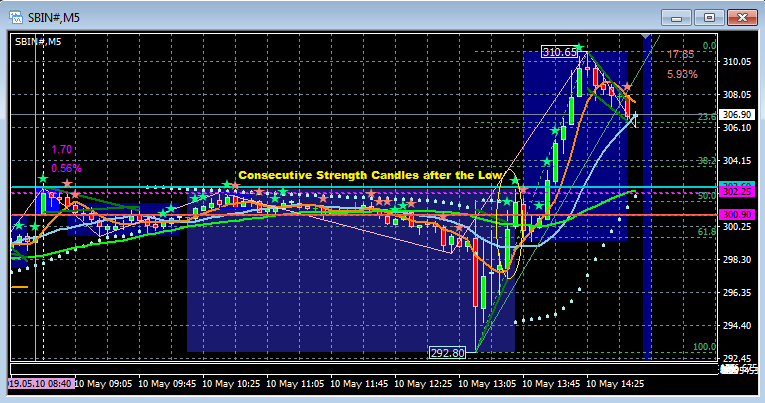
Close look at the Consecutive Candles.

Next two Steps 3 & 4 can precede each other on first come first basis. If Step 4 occurs one can act as Step 3 will follow.
STEP 3
EMA Ratio Confirmation which is about converging EMA’s diverging from each other.
Let’s identify visually for Short Sell.
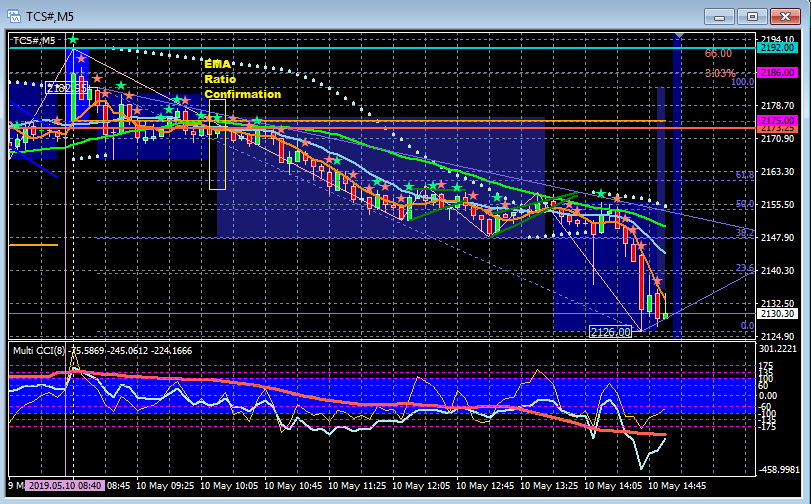
Close look at the EMA Ratio Confirmation with calculation methodology as follows.
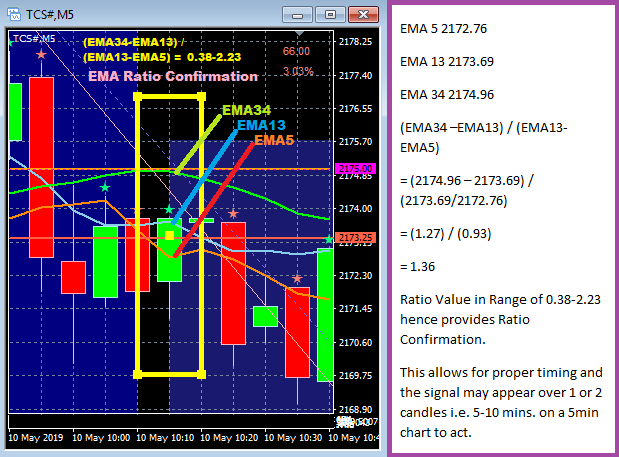
Ratio Value in Range of 0.38-2.23 provides EMA Ratio Confirmation.
This allows for proper timing and the signal may appear over 1 or 2 candles i.e. 5-10 mins. on a 5min chart to Act.
Let’s identify visually EMA Ratio Confirmation for reversal that leads to Longs.

Here the EMA Ratio Confirmation is delayed as the EMA’s had not converged closely prior to diverging. This is the reason why we are open about Step 3 and Step4 can precede each other and whichever occurs first to be taken as signal
Step 4
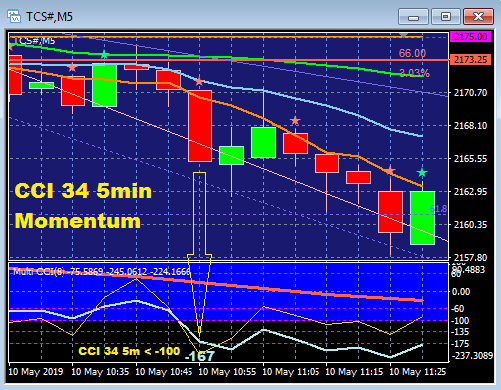
Lower Time Frame CCI 34 5min moving above 100 or below 100 for Lower Time Frame Momentum.
If it precedes EMA Confirmation, the same can be taken as a signal to Act even if EMA Ratio Confirmation hasn’t occurred.
Let’s identify visually Reversal for Short Sell

Here the CCI 34 5min < -100 follows after EMA Ratio Confirmation. So Step 3 can be trigger to Act.
Close look for CCI 34 5min < -100
Let’s identify visually Reversal for going Long.

Here the CCI 34 5min > 100 precedes Ratio Confirmation and can be considered to Act, even if Ratio Confirmation is yet to occur.
Close Look for CCI 34 5m > 100

Observing Red CCI 34 30min preceding moving above 100.
If at all CCI 34 30min moves above 100 or below -100 earlier than CCI 34 5min and if the EMA Ration confirmation is in place, it can be considered to supersede CCI 34 5min, as is seen in these case happening where CCI 34 30min crossing above 100 is three candles earlier i.e. 15min earlier.
STEP 5
Previous Day & Prior Day Open proves as Resistances or Supports in Reversal Buy or Sell respectively.
When Step 4 is reached one can review chart on a Daily Time Frame and note the previous day and prior to previous day Opens too. These Opens stand as resistances. If price moves above these resistances explosive spurt can be expected.
Let’s watch the same in case of earlier 4 day 15min charts with their Open and the price movement after crossing those Opens.
Continuation Lines from previous day opens are marked on current day chart and you will observe how much they matter.

Once these supports give way for a further fall one can be sure a medium term Top is formed and Intra Day trade can be converted into a Positional Trade.
Let’s now watch how previous Open Levels prove to be resistance levels in case of reversal to Longs.
Continuation Lines from previous day opens are marked on current day chart and you will observe how much they matter.
The earlier Open Levels prove to be resistance levels to cross for further upside spurt. Once done can be sure of a medium Term Bottom and Intraday trade can be converted into a Positional Trade.
Close above or below previous day ensures better directional price movement next day.
STEP 6
Higher Time Frame CCI 34 30min turning above 100 is a confirmed momentum for next 2-3 days.
Trade is confirmed as Positional once that happens.
STEP 7 Exists
Exits apply as per below:
Cardinal Rule to Stay in Trade for CCI 34 5min:
Buy Hold/Long till CCI 34 5min remain above -60
Sell Hold/Short till CCI 34 5min remains below 60.
How to go about practicing?
System trigger tweets from @kkonline.com @orbalerts are available and they can be used for study and trading as per description. Chart set up may also be available.
Reversal trades can to be erratic to trades.
Queries or clarifications can be posted.
Leave a Reply