Pullbacks & CCI Indicator
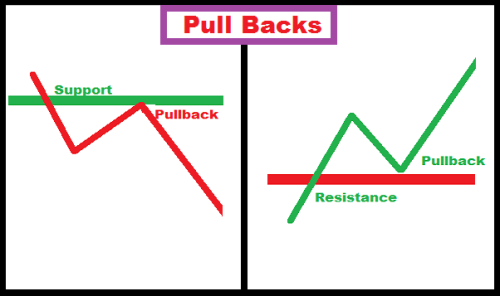
Pull Backs are discussed with CCI Indicator as supporting tool. We begin with brief parameters of CCI in use here.
Commodity Channel Index referred as CCI is used with two variables, period and time frame.
Period pertains to No. of Candles and the Time of Candle in minutes or hours or days or weeks or months or yearly for which the Closing Price is available.
Say, if it is technically written as CCI 34 30min, then the number of candles it considers is 34 and period of each candle is 30min.
Say, if it is technically written as CCI 34 5min, then the number of candles it considers is 34 and period of each candle is 5min.
Similarly, if it is technically written as CCI 8 5min, then the number of candles it considers is 8 and period of each candle is 5min.
We differentiate period 5min as Lower Time Frame and 30min as Higher Time Frame for Intra Day Trading.
Notes below are purely observational and any theoretical construct can be studied as per a few website mentioned at the end.
A standard Nimblr TA chart has a price window and below a Multi Time Frame CCI (MTF CCI) window.
Let us focus on the below price window.
It has three CCI Lines.
Thin Yellow – CCI 8 5min
Thick Blue – CCI 34 5min
Thicker Red – CCI 34 30min
Observe the thin Yellow line oscillates the most as it is on Lower Time Frame of 5min and even period 8.
Followed with lesser oscillating CCI 34 5min and least oscillating CCI 34 30min. The chart time frame is on 5min.
Observe the lines above zero of 60, 100,135 and 175 and below zero of -60,-100,135 and -175.
We classify price movements under following two trades:
MOMENTUM TRADES
PULLBACK TRADES
REVERSAL TRADES
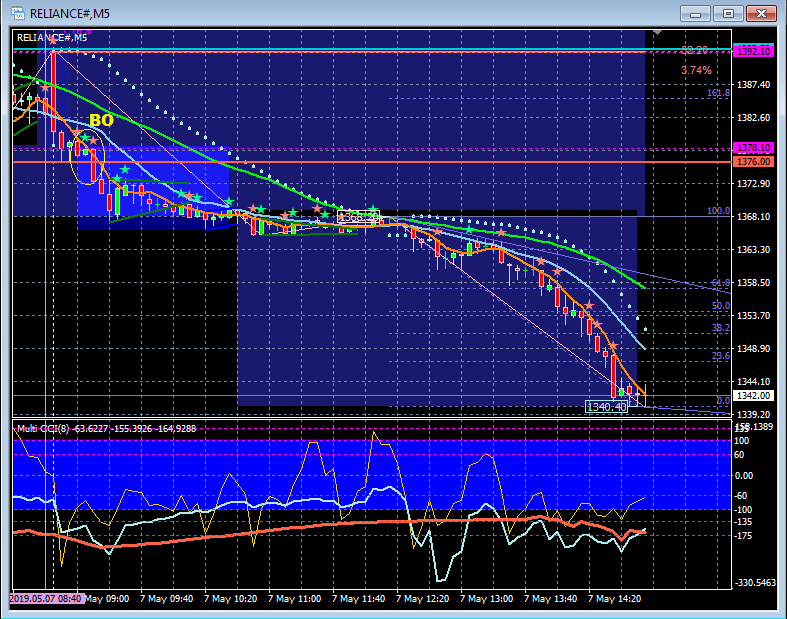
Let’s start deeply observing Momentum Trades for which CCI 8 5min is instrumental.
We call them Momentum Trades on Intra Day because apart from CCI 34 30min>100 condition they also satisfy breakout above day’s Open Range High.
Let’s take CCI 8 5min and following chart for dissertation.
It is the one we use to Enter and Exit a trade provided some conditions are true.
General Rule for CCI 8 5min in Momentum-Pullback Trade or that matter many other conditions taken up later are:
CCI 8 5min Buy/Long if < -135
CCI 8 5min Sell/ Short > 135
This Cardinal Rule is used to Enter a Buy trade when <-135 and Exit or Book Profits when >135 to complete or close the trade.
Similarly, Enter a Sell trade when >135 and Exit or Book Profits when <-135.
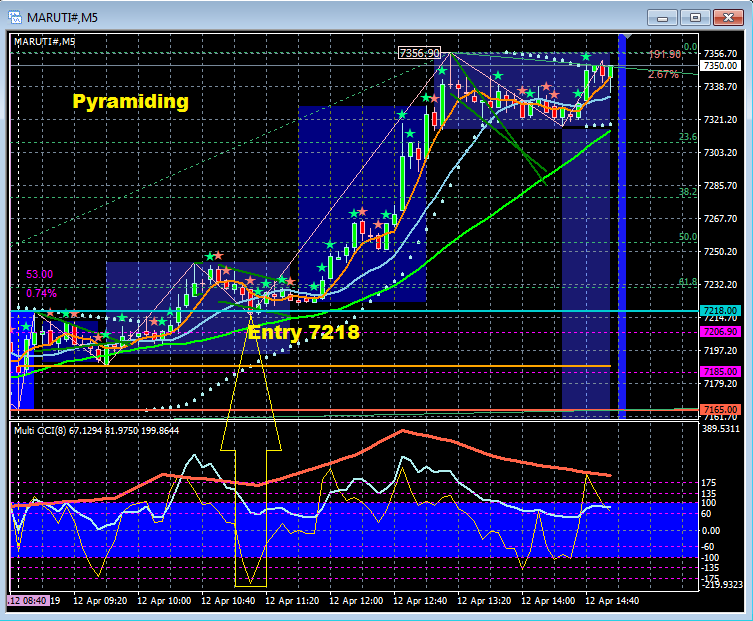
Pullback Trades are best to add positions to your earlier entry and also called a Pyramiding trades.
In such Pullback and Pyramiding trades the original trend of underlying is highly bullish or bearish.
In ascertain this bullishness and bearishness we move to observe CCI 34 30min which determines our trade direction to trade.
If CCI 34 30min is >100 or just breaks out above 100 it is said to have gathered Bullish Momentum.
The Cardinal Rule that must support the Entry as per CCI 8 5min is concurrently CCI 34 30min must be:
Buy/Long if > 110
Sell/Long if <-110
Both collectively, the Conditions for Pullback & Pyramiding Entry are:
Buy/Long if:
CCI 8 5min < -135 provided CCI 34 30m >110
Sell/Short if:
CCI 8 5min>135 provided CCI 34 30m < -110
Let’s start deeply observing purely Pullback Trades for which CCI 8 5min is equally instrumental as ever.
We call them pure Pullback Trades on Intra Day because they do not need occurrence of Breakout above Days Open High apart from CCI 34 30min>100 condition of Momentum.
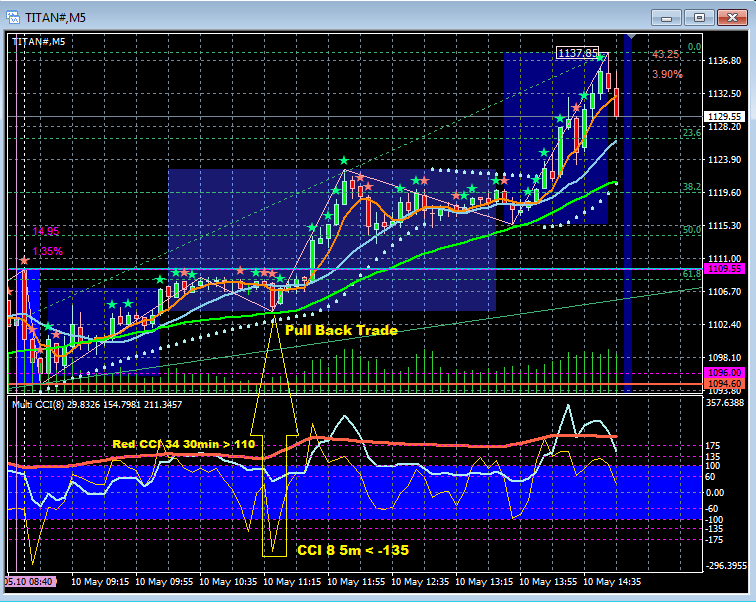
All other conditions and process mentioned before remains same except for the location of Pullback Entry can be prior to Breakout.
With his we complete Role of CCI 8 5min in Pullback Entries and Pull Back in general and move on in the next blog post to the Role of CCI 34 5min in Staying in the Trade.
How traders use CCI? https://www.investopedia.com/articles/active-trading/031914/how-traders-can-utilize-cci-commodity-channel-index-trade-stock-trends.asp
Commodity Channel Index https://stockcharts.com/shttps://stockcharts.com/school/doku.php?id=chart_school:technical_indicators:commodity_channel_index_ccichool/doku.php?id=chart_school:technical_indicators:commodity_channel_index_cci
Multi Time Frame https://www.mql5.com/en/market/product/15372
Chartilink Screener for Intra Day Buy/Long https://chartink.com/screener/cci-momentum-retracment-buy
Chartlink Screener for Intra Day Sell/Short https://chartink.com/screener/copy-cci-momentum-invest-14
Chartlink Screener for Investment Buy Pullbacks https://chartink.com/screener/copy-cci-momentum-invest-3
CCI
Leave a Reply